The short version
A confounding variable is something that affects both sides of a comparison you're making, without you realizing it's in the picture. Ice cream sales and drowning deaths rise and fall together through the year, and neither one causes the other. Both track summer heat. Pull the temperature out of the picture and the connection between ice cream and drowning disappears.
That version is easy to spot once someone points it out. The harder version is when the confound doesn't just weaken a correlation, it reverses one. A group can win a comparison in every single subcategory and still lose when the categories get combined, because the confound decided which cases ended up in which group to begin with. It's the same kind of trap as an argument whose logical form looks airtight while a premise underneath it is quietly false: the surface structure of the comparison is sound, the number feeding into it isn't measuring what it claims to measure.
The surgery that won every subgroup and still lost the study
In 1986, four London urologists published a comparison of two ways to remove kidney stones in the British Medical Journal: open surgery, the older and more invasive option, against percutaneous nephrolithotomy (PCNL), a newer technique that reaches the stone through a small puncture instead of a full incision. They tracked 350 patients who got each treatment and recorded success by stone size.
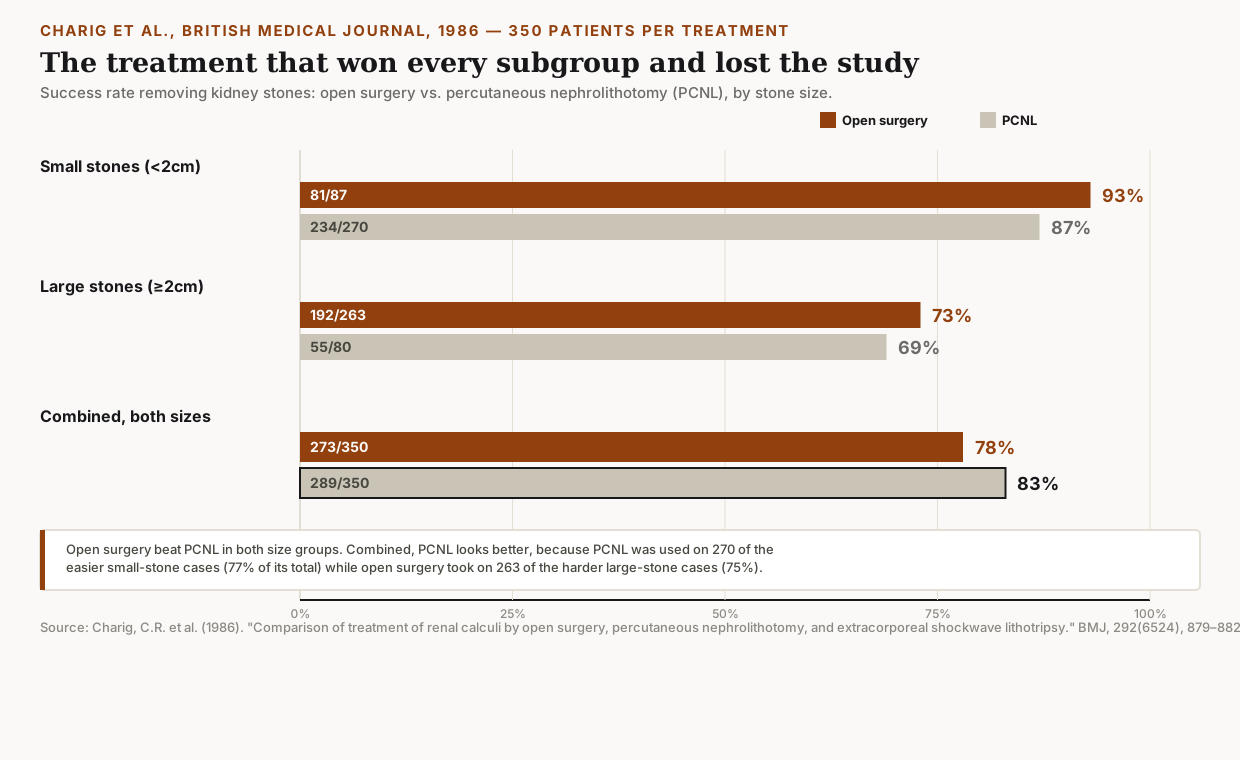
For small stones, open surgery succeeded in 81 of 87 cases, 93%. PCNL succeeded in 234 of 270 cases, 87%. Open surgery wins. For large stones, open surgery succeeded in 192 of 263 cases, 73%. PCNL succeeded in 55 of 80 cases, 69%. Open surgery wins again. Then look at all 350 patients per treatment combined, no split by stone size: open surgery's overall rate is 78% (273 of 350). PCNL's overall rate is 83% (289 of 350). The treatment that lost in both size categories now has the higher number.
Why the reversal happens: stone size decided both the treatment and the outcome
Nobody in this study faked a number. The reversal happens because stone size wasn't handed out at random between the two treatments. Of open surgery's 350 patients, 263 (75%) had large, harder-to-treat stones. Of PCNL's 350 patients, 270 (77%) had small, easier-to-treat stones. Physicians were more likely to reach for the newer, less invasive PCNL on the cases that were already easier to resolve, and more likely to use the established, invasive procedure on the harder ones.
That single fact, stone size, meets both conditions that make something a confounding variable rather than a coincidence: it's correlated with which treatment a patient received, and it independently affects the odds of success regardless of which treatment gets used. Average the results without accounting for it, and PCNL's total gets padded with easy wins while open surgery's total gets weighed down with the hard cases it was disproportionately assigned. The subgroup numbers were never wrong. The combined number was measuring stone-size mix as much as it was measuring the treatments.
The same shape of error, outside medicine
The same reversal turned up in a 1973 University of California, Berkeley graduate admissions dataset. Of 8,442 men who applied, 44% were admitted. Of 4,321 women who applied, 35% were admitted, a gap wide enough that Berkeley was sued for sex discrimination. Statisticians Peter Bickel, Eugene Hammel, and J. William O'Connell re-analyzed the same applications broken out by department instead of pooled together, and published the result in Science in 1975.
Once department was accounted for, the pattern didn't just shrink. It reversed to "a small but statistically significant bias in favor of women," in the paper's own words. Women had disproportionately applied to the most competitive departments on campus, the ones with low admission rates for men and women alike (English was one cited example), while men had disproportionately applied to departments with much higher admission rates for everyone, engineering among them. Which department someone applied to was the confound: correlated with gender in the applicant pool, and independently a huge driver of whether any given application got accepted, regardless of the applicant's gender.
A confound that took three decades to fully correct
Not every confound gets caught inside one dataset. In 1981, epidemiologist Brian MacMahon and colleagues published a case-control study in the New England Journal of Medicine linking coffee drinking to pancreatic cancer, questioning 369 patients with the disease and 644 hospital controls about their coffee, tea, alcohol, and tobacco habits. The paper reported the coffee association held up even after adjusting for cigarette use, and the finding made international headlines.
Later scrutiny found a different problem with the study: many of its hospital controls had been referred by physicians for gastrointestinal complaints and had been told to cut back on coffee, which meant the comparison group's coffee habits weren't representative of the general population to begin with. Smoking remained the harder confound to fully rule out, because heavy smokers tend to drink more coffee and smoking is independently one of the strongest known risk factors for pancreatic cancer. It took large, later prospective studies, including the UK's Million Women Study, to test the link specifically among people who had never smoked, and a 2012 meta-analysis pooling 54 studies and 10,594 cases (published in Annals of Oncology) found no appreciable overall association between coffee and pancreatic cancer once smoking was properly accounted for. A hypothesis that made front-page news in 1981 took roughly three decades of further research, much of it aimed at isolating smoking as the real driver, to work its way back out of the medical literature. A single well-designed study can carry a number that sounds more settled than the underlying method actually supports, and coffee-and-cancer headlines rode that gap for years before the correction caught up.
How to actually check for one
A number that compares two groups is only as good as whatever decided who ended up in each group. Before treating a comparison as settled, it's worth asking three things. First: was assignment to each group actually random, or did something, doctor judgment, self-selection, geography, income, decide who ended up where? The kidney stone study wasn't randomized, physicians chose the treatment, which is exactly how stone size snuck in as a confound. Second: is there a third factor plausibly connected to both sides of the comparison, not just one? Stone size affected treatment choice and treatment success. Department choice affected both gender distribution and admission odds. A real confound has to touch both variables, not just one of them.
Third, and easiest to check from the outside: does the reported number hold up inside subgroups, or does it only exist in the combined total? Reporters and researchers who stratify by the plausible confound, whether that's department, stone size, or smoking status, and still find the same pattern have a much stronger claim than one built entirely on an aggregate. That's the same instinct behind checking who produced a number and what got left out of it: a hidden third variable is one of the most common things left out.
Surveys have their own close relative of this problem: nonresponse bias, where the hidden factor isn't a third variable acting on a comparison, but whether the decision to answer a specific question is itself correlated with the answer. A 2017 Pew Research benchmarking study found that same signature, a low-response phone poll landing within a point or two of high-response government data on some questions and missing by 38 points on others, depending entirely on which question was being asked.