The short version
Nonresponse bias is what happens when the people who skip a survey are different, on the specific thing being asked, from the people who answer it. It isn't the same as a survey simply having few respondents. A survey can run at a rock-bottom response rate and still land close to the truth, if answering it has nothing to do with the topic. It can also have a solid response rate and still be wrong, if the people who opt out lean hard one way on exactly the question being measured.
That distinction is easy to state and hard to believe until you see it inside one actual survey. Pew Research Center's telephone polls were running at a 9% response rate in 2016, low enough that plenty of people assumed the results couldn't be trusted on much of anything. When Pew checked those results against high-response government surveys question by question, some answers were dead-on. Others were off by dozens of points. Same poll, same response rate, wildly different accuracy depending on what was being asked.
The survey that got neighbors wrong by 38 points and party ID right
In 2017, Pew Research Center published its fourth study tracking what falling survey response had actually done to accuracy, following similar checks in 1997, 2003, and 2012. By 2016, its live-interviewer telephone polls were reaching a 9% response rate, down from 37% two decades earlier in 1996. To find out what that drop had cost, Pew compared 29 questions from its phone surveys against the same or nearly identical questions from surveys with far less nonresponse: the Current Population Survey (87% response) and the General Social Survey (60%+ response, conducted in person).
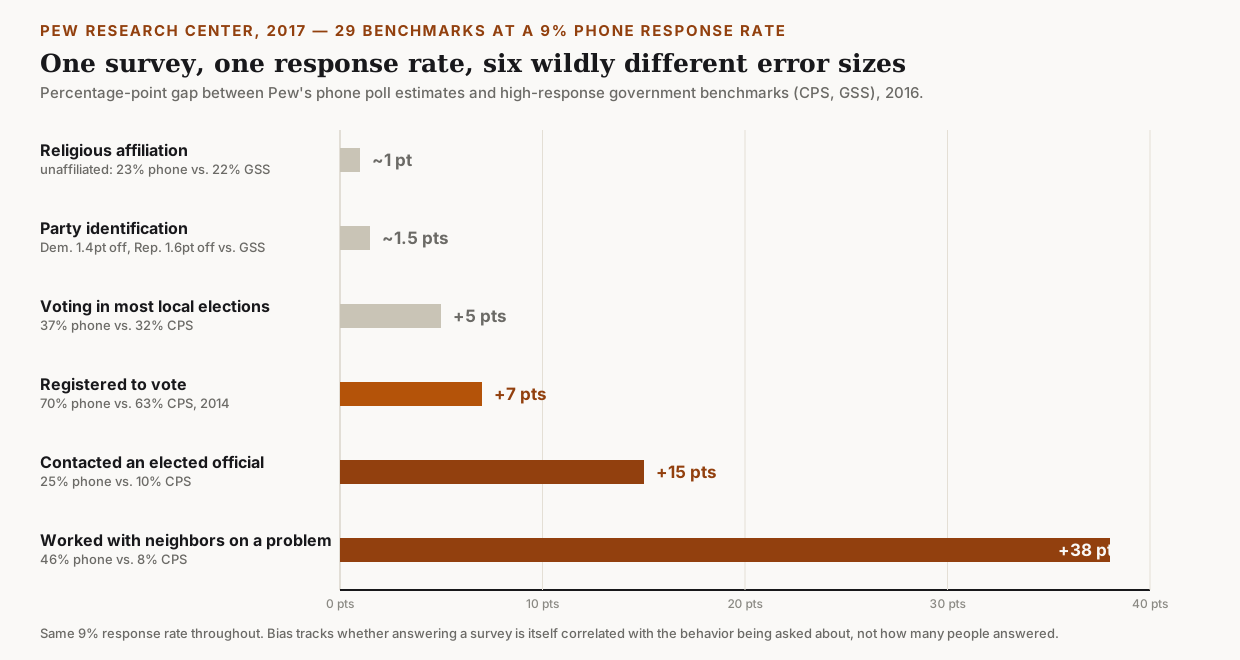
On some questions, the match was close. Party identification: Pew's 2016 phone polls found Democrats ahead of Republicans by 7 points; the high-response General Social Survey found Democrats ahead by 9 points, a gap of about 1.4 to 1.6 points depending on which party's share is compared. Religious affiliation: Pew found 23% of adults religiously unaffiliated in 2016, the GSS found 22%, a 1-point gap. Other questions drifted further. On voting in most local elections, 37% said yes on the phone versus 32% in the Current Population Survey, a 5-point overstatement. Voter registration: 63% in 2014 CPS data, 70% on the phone, a 7-point gap that Pew found was similarly sized back in 1996, when the phone response rate was still 37% rather than 9%. On civic participation, the same polls weren't close at all. The Current Population Survey found 8% of adults had worked with neighbors to fix a community problem in the past year. Pew's phone polls put that figure at 46%, a 38-point overstatement. Contacting an elected official: 10% in the CPS, 25% on the phone, a 15-point gap.
Why response rate wasn't the variable that mattered
The obvious guess is that Pew's phone polls got worse across the board as fewer people picked up, and civic engagement just happened to be measured worse than party affiliation for some unrelated reason. The research points somewhere more specific: whether a question gets distorted by nonresponse depends on whether willingness to take the survey is itself correlated with the answer to that particular question, not with the overall response rate.
A 2009 study by Katharine Abraham, Sara Helms, and Stanley Presser, published in the American Journal of Sociology, traced the mechanism directly. They compared Current Population Survey respondents who went on to answer a separate follow-up survey against CPS respondents who skipped that follow-up, using the volunteering answers both groups had already given on the CPS itself. The respondents who continued on to the follow-up had reported more volunteer work on the earlier CPS than the ones who dropped out, evidence that agreeing to keep participating in surveys is a mildly prosocial act, correlated with the same underlying willingness to volunteer, contact officials, and get involved locally that the civic-engagement questions were trying to measure. That correlation inflates every civic-participation number specifically. It has no obvious reason to touch a question about which political party someone identifies with, which is why that number stayed close to accurate even as response collapsed.
This holds up at a larger scale, too. Robert Groves, a survey methodologist who later directed the U.S. Census Bureau from 2009 to 2012, published a 2006 meta-analysis in Public Opinion Quarterly pooling 59 separate studies that had directly measured nonresponse bias rather than just reporting response rate. Across those studies, response rate itself explained only about 11% of the variance in how much bias actually showed up. Some surveys under a 20% response rate had bias levels similar to surveys above 70%. It's the same shape of problem as a hidden factor deciding who ends up on each side of a comparison before anyone runs the numbers: the response rate is the figure everyone can see, but it isn't the figure doing the damage.
The 1936 poll that named the wrong president
The starkest historical case predates Groves and Pew by seven decades. In 1936, The Literary Digest, a general-interest magazine that had correctly called every U.S. presidential election since 1916 using the same straw-poll method, mailed 10 million ballots to a list built from telephone directories, car registrations, and its own subscriber rolls. About 2.4 million people mailed a ballot back, a 24% response rate on an enormous sample. The Digest predicted Alf Landon would beat incumbent Franklin Roosevelt, 57% to 43%. Roosevelt won, 62% to 38%, one of the largest misses in the history of American polling.
The standard explanation blames the mailing list: telephones and cars skewed toward wealthier households in 1936, who leaned more Republican than the country as a whole. Political scientist Peverill Squire re-examined the failure in a 1988 Public Opinion Quarterly paper, using a follow-up 1937 Gallup survey that had separately asked people whether they'd been polled by the Digest and how they'd voted. Squire found the mailing list's skew alone wasn't enough to explain a result that far off. Landon supporters who received a ballot were also more likely to mail it back than Roosevelt supporters who received one, adding a second, independent layer of nonresponse bias on top of the flawed sample. Squire's calculation: if everyone who received a ballot had actually returned it, the Digest's already-skewed sample would still have called the right winner. The extra miss came specifically from who chose to respond.
How to actually check for it
A stated response rate on its own says almost nothing about whether a specific number is trustworthy. What's worth asking instead: does answering this particular survey plausibly correlate with the answer to this particular question? A poll about a hobby is likely to overrepresent people who care enough about that hobby to spend ten minutes on a survey about it. A poll about which brand of dish soap someone buys has a much less obvious connection to who bothers to answer the phone.
Second, look for whether the pollster checked, rather than assumed. Pew's 2016-2017 study is worth trusting specifically because it benchmarked its own numbers against independent, high-response surveys and reported where it was wrong, including the 38-point miss, rather than only publicizing the parts that held up. The same self-selection logic shows up outside polling too, in who chooses to enter a given pool in the first place rather than getting randomly assigned to it: a group that opts in is rarely a representative slice of the population it's drawn from.
Third, be specific about what a low response rate is actually doing in the sentence you're reading. A number repeated with total confidence isn't the same thing as a number whose precision has actually been checked against something outside itself, and "the response rate was only 9%" does a lot of work in headlines that never mention whether anyone benchmarked the result against anything. The response rate is the easy number to report. Whether it correlates with the topic being measured is the number that actually decides whether to trust the result.