The short version
A confidence interval is a range, not a single number, and the percentage attached to it isn't a promise about that one range. It's a track record about the method that produced it. When a poll reports "50% ± 3 points, 95% confidence," the 95% describes what happens if you ran that exact polling method over and over on repeated random samples: 95 times out of 100, the range it produces would contain the true value. It says nothing about whether this particular range, from this particular poll, is one of the 95 or one of the 5.
That distinction sounds pedantic until you notice how confidence intervals get used. A number that sounds like "95% sure" gets treated as a guarantee, not a long-run average with a built-in failure rate. And the sources that build these intervals, pollsters, researchers, forecasters, are rarely the ones pointing out how much less certain their own 95% turns out to be in practice than it sounds.
What the 95% is promising you
The American Association for Public Opinion Research states the standard definition plainly: with a 95% confidence level, "in 95 times out of a 100, we expect that the answer we get from the survey will fall somewhere within our margin of sampling error. But about five times out of 100 it will not." A five-in-a-hundred miss rate is built into the definition. It isn't a sign something went wrong when it happens.
The catch is what the margin of sampling error covers. It only accounts for the error that comes from surveying a sample instead of the whole population. It doesn't account for the other documented sources of survey error researchers track separately: a poorly worded question, a sample that doesn't match the population, systematic nonresponse from certain kinds of people, bias introduced by how a question gets asked, plain data-processing mistakes. AAPOR says it outright: "There is no such thing as a measurable overall margin of error for a poll." The number printed next to a poll result is real. It's just measuring a narrower slice of the total error than most readers assume it's measuring.
The study that checked whether the promise holds
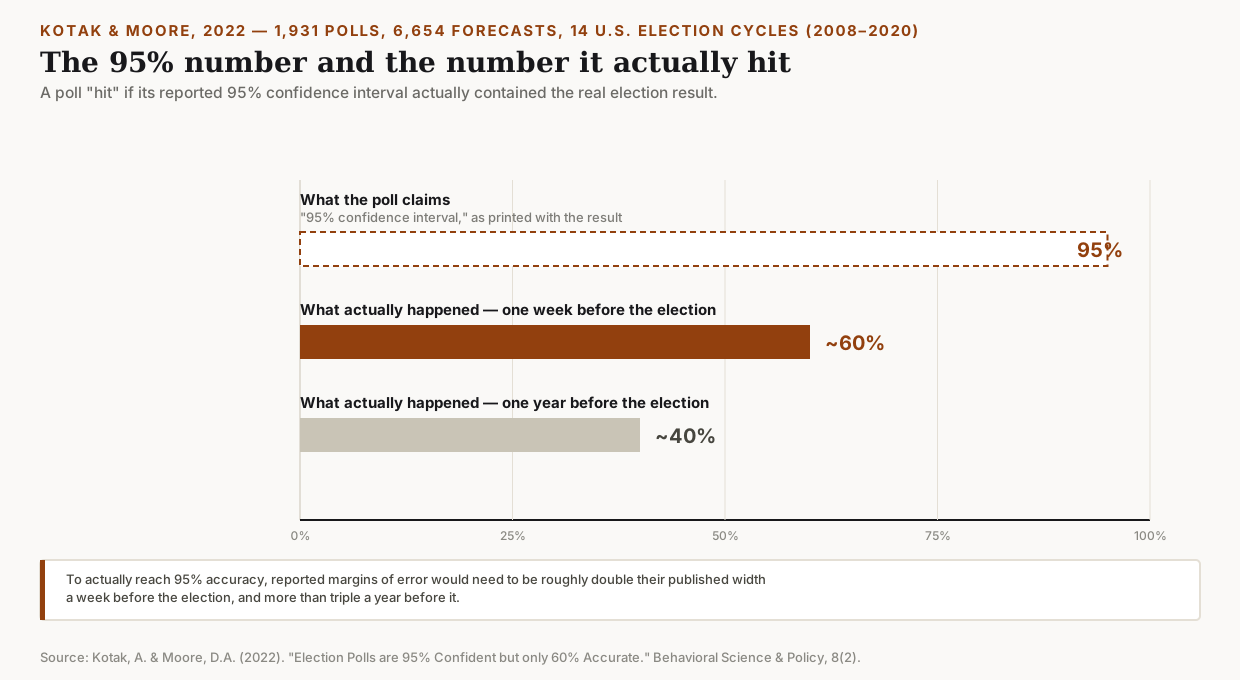
In 2022, UC Berkeley researchers Aditya Kotak and Don Moore tested that promise against real outcomes instead of taking it on faith. They pulled 1,931 polls from RealClearPolitics covering 14 U.S. election cycles between 2008 and 2020, general elections plus the Iowa and New Hampshire primaries, producing 6,654 individual vote-share forecasts with a reported margin of error attached to each.
A poll "hit" if its 95% confidence interval contained the real election result. In the week before an election, the average hit rate came out to about 60%, not 95%. A year out, it dropped to around 40%. Kotak and Moore then calculated how much wider the reported margins of error would have had to be to reach 95% accuracy: roughly double, a week before the election, and more than triple, a year before it. They also checked whether polls have gotten worse since 2016, a theory that circulated after that election, and found no such trend. The miss rate looked about the same across the years in the dataset, no better and no worse.
The "lead" a headline reports is usually smaller than it looks
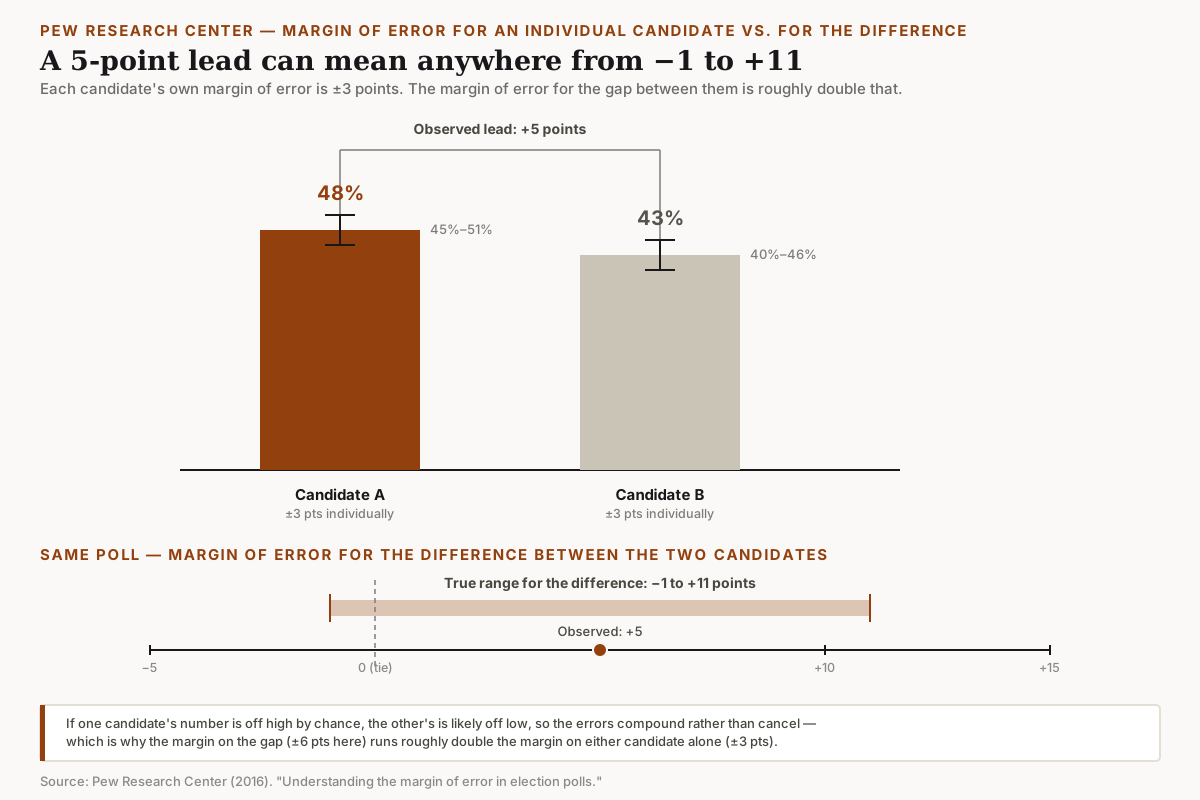
Most published margins of error describe one candidate's number, not the gap between two candidates, and that distinction is where a lot of horse-race coverage goes wrong. Pew Research Center walks through the arithmetic with a specific worked example: a poll showing 48% support for one candidate, with the standard ±3-point margin, means that individual figure could reasonably fall anywhere from 45% to 51%. But the margin of error for the difference between two candidates is roughly double the individual figure, about 6 points in this case, because if one candidate's number happens to be off high by chance, the other's is likely off low, so the two errors compound instead of canceling out.
Run the numbers on an actual 5-point lead, say 48% to 43%, and Pew's own conclusion is that the true gap could reasonably fall anywhere from a 1-point deficit to an 11-point lead. A headline calling that a lead is presenting a five-point difference as far more settled than the poll's own math supports, the kind of logic-shaped logos that looks like data without doing the work data is supposed to do: technically accurate, selectively precise. Pew's rule of thumb is that a candidate needs to be ahead by roughly double the individual margin of error, not simply ahead at all, before the lead is distinguishable from noise.
Why the "shocking new poll" usually isn't shocking
Because a 95% confidence interval is built to miss 5% of the time, a large enough batch of polls will always produce a few real outliers, and those tend to be the ones that make news. Pew points to a concrete case: from January 2012 through the election, HuffPost Pollster tracked 590 national polls on the Obama-Romney race. At the standard 95% threshold, roughly 30 of those polls, about 5%, were mathematically expected to land outside their own reported margin of error purely by chance. Pew's own description of what happens next: these outlier polls "end up receiving a great deal of attention because they imply a big change in the state of the race and tell a dramatic story." A poll that lines up with the last ten polls doesn't get that treatment. That is the same pull toward the dramatic data point over the representative one that shows up in an actual count of how fast 140 real online controversies faded.
The stakes aren't always just a misleading headline. Ahead of the 2016 Republican primary debates, television networks used aggregated polling averages to decide which candidates qualified for prime-time slots. AAPOR's own account notes that some of the ranking differences separating candidates were measured in tenths of a percentage point, well within the polls' aggregate margin of sampling error, which meant the polls couldn't support a confident ranking of the field. AAPOR cautioned against using polling data that way at all. A confidence interval too narrow to distinguish candidate #4 from candidate #5 still ended up deciding who got a microphone on national television.
Knowing the real numbers didn't fix people's confidence
Kotak and Moore's second study tested whether telling people the truth helps. They recruited 217 U.S. adults and showed each of them the same hypothetical poll result in seven different formats, ranging from a bare percentage to a full 95% confidence interval, with two of the formats explicitly paired with the poll's real historical accuracy rate (60% one day out, 55% at three months, 35% at one year, the actual numbers from their first study). For every format, participants rated how confident they were that the poll's result would match the real outcome.
Average stated confidence came out to 59.9%. Average real accuracy, based on Study 1's data, was 49.7%, a gap large enough to be statistically decisive (t(216)=6.81, p<10⁻¹¹). The two formats that explicitly stated the poll's real historical miss rate in the same sentence as the result didn't close that gap. People who were told outright that this kind of forecast is right about 55-60% of the time near an election still reported confidence well above that number. Being handed the honest accuracy rate and the confident-sounding number in the same breath wasn't enough to override the pull of the second one.
What to do with a number like this
None of this means confidence intervals are useless or that polls should be ignored. It means the "95%" attached to a single poll is weaker evidence than it sounds, and a few habits catch most of where that gap gets exploited: check whether a reported "lead" sits outside the doubled margin of error for the difference, not just above zero. Treat any single dramatic poll as one data point among many rather than a story on its own, since a batch of otherwise-solid polls is expected to throw off a few real outliers by design. And when a number carries a stated confidence level, ask what kind of error that percentage is accounting for, sampling alone, or something closer to the full picture.
That's a narrower version of the same five questions that apply to any claim built on data: who produced this number, what did they leave out of it, and would the conclusion survive someone actually running the math.